
OMV Petrom Group: results for Q3 and January – September 2016
Q3/16
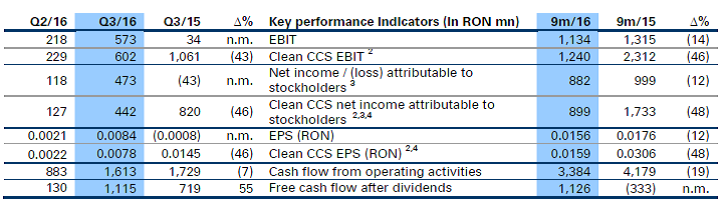
- Free cash flow at RON 1.1 bn, based on capex prioritization and very good operational performance
- Clean CCS EBIT at RON 602 mn, supported by Downstream contribution
- Upstream production at 174 kboe/d; OPEX at 11.3 USD/boe, reflecting efficiency measures
- Downstream Oil: high refinery utilization rate and good retail sales volumes
- Downstream Gas: high gas and power sales, challenging gas market
Mariana Gheorghe, CEO of OMV Petrom S.A.: “In the context of weak oil and gas prices and significantly reduced refining margins vs. previous year, OMV Petrom’s efforts focused on operational resilience and delivered good results. In Q3/16, we continued with CAPEX prioritization and strict cost discipline, which translated into a RON 1.1 bn free cash flow. Our constant focus on the most profitable barrels led us to revisit the CAPEX guidance for 2016, from EUR 0.7 bn to EUR 0.6 bn (-30% yoy). In Upstream, the reduction in production costs and exploration expenses partly compensated the weak prices. The Downstream contribution to Group result was very strong, driven by good operational performance of both Downstream Oil and Downstream Gas, despite a challenging market environment. As a result of all our efforts, OMV Petrom delivered a clean CCS EBIT of RON 602 mn and a sound operating cash flow of RON 1.6 bn in Q3/16. On 20 October 2016, the sale by Fondul Proprietatea of a 6.4% stake in OMV Petrom (in the form of shares and GDRs) was closed and led to an increase of our free float to 15.8%. On the same day, OMV Petrom’s GDRs started trading on the London Stock Exchange.“
1The financials are unaudited and represent OMV Petrom Group’s (herein after also referred to as “the Group”) consolidated results prepared according to IFRS; all the figures refer to OMV Petrom Group, unless otherwise stated; financials are expressed in RON mn and rounded to closest integer value, so minor differences may result upon reconciliation; OMV Petrom uses the National Bank of Romania exchange rates for its consolidation process
2 Adjusted for exceptional, non-recurring items; Clean CCS figures exclude special items and inventory holding effects (CCS effects) resulting from Downstream Oil
3 After deducting net result attributable to non-controlling interests
4 Excludes additional special income of RON 67 mn from clearance of a legal dispute and reflected in the financial result
Group performance
Third quarter 2016 (Q3/16) vs. second quarter 2016 (Q2/16)
Consolidated sales in Q3/16 amounted to RON 4,461 mn, 23% higher compared to Q2/16, mainly due to seasonally better sales of petroleum products coupled with higher quantities of electricity sold, which fully compensated for the decrease in gas sales. Downstream Oil represented 76% of total consolidated sales, while Downstream Gas accounted for 22% and Upstream for 2% (sales in Upstream being largely intra-group sales rather than third-party sales).
Clean CCS EBIT increased from RON 229 mn to RON 602 mn, reflecting higher sales in Q3/16 and the Petrobrazi refinery turnaround in Q2/16. Clean CCS EBIT is stated after eliminating inventory holding losses of RON (40) mn (Q2/16: inventory holding gains of RON 44 mn).
The Group’s EBIT increased to RON 573 mn (Q2/16: RON 218 mn), being also influenced by lower exploration expenses, as Q2/16 was impacted by write-offs of exploration assets.
The net financial result was a loss at the amount of RON (16) mn, compared to a loss of RON (86) mn in Q2/16, following the special income from the clearance of a legal dispute and the positive effect of exchange rates evolution in relation to bank loans denominated in EUR.
Consequently, the profit before tax for Q3/16 of RON 557 mn was significantly higher compared with the result of RON 132 mn recorded in Q2/16.
Income tax level of RON 84 mn led to an effective tax rate of 15% in Q3/16.
Net income attributable to stockholders (i.e. net income attributable to stockholders of the parent) in Q3/16 was RON 473 mn, compared to RON 118 mn in Q2/16, while clean CCS net income attributable to stockholders increased to RON 442 mn from RON 127 mn in Q2/16. EPS was RON 0.0084 in Q3/16 vs. RON 0.0021 in Q2/16, while Clean CCS EPS was RON 0.0078 compared to RON 0.0022 in Q2/16.
Cash flow from operating activities amounted to RON 1,613 mn and was well above Q2/16 level (RON 883 mn). Free cash flow after dividends amounted to RON 1,115 mn (Q2/16: RON 130 mn).
Third quarter 2016 (Q3/16) vs. third quarter 2015 (Q3/15)
Compared to Q3/15, sales decreased by 7%, as the decline in oil prices more than offset higher volumes of petroleum products, electricity and gas sold.
Clean CCS EBIT of RON 602 mn was below the value recorded in Q3/15 of RON 1,061 mn, reflecting mainly the unfavorable oil and gas price environment. Clean CCS EBIT for Q3/16 is stated after eliminating net special income of RON 11 mn and inventory holding losses of RON (40) mn, while Q3/15 is stated after eliminating net special charges of RON (833) mn (mainly in relation to impairment of assets in Upstream) and inventory holding losses of RON (194) mn.
The Group’s EBIT for Q3/16 amounted to RON 573 mn, well above the result recorded in Q3/15 of RON 34 mn, due to the significant impairment of production assets in Q3/15, as a consequence of the reduced oil price assumptions, and lower exploration expenses in Q3/16.
The net financial result improved from a loss of RON (83) mn in Q3/15 to a loss of RON (16) mn in Q3/16, due to special income from the clearance of a legal dispute.
Consequently, the profit before tax for Q3/16 of RON 557 mn was significantly higher compared with the loss of RON (48) mn recorded in Q3/15.
Net income attributable to stockholders (i.e. net income attributable to stockholders of the parent) was RON 473 mn, while clean CCS net income attributable to stockholders was RON 442 mn. EPS was RON 0.0084 in Q3/16 vs. RON (0.0008) in Q3/15, while Clean CCS EPS was RON 0.0078 compared to RON 0.0145 in Q3/15.
Cash flow from operating activities amounted to RON 1,613 mn and was below the level in Q3/15 (RON 1,729 mn), reflecting mainly the lower pricing environment, partially offset by the encashment in Q3/16 of the amounts by which the initial Competition Council fines had been reduced by court decisions in
Statement of financial position and capital expenditure
Capital expenditure decreased to RON 1,815 mn (9m/15: RON 2,997 mn), mainly due to substantially lower CAPEX in Upstream.
Upstream investments in 9m/16 were RON 1,484 mn, compared to RON 2,790 mn in 9m/15. Downstream investments amounted to RON 328 mn (9m/15: RON 203 mn), thereof RON 320 mn in Downstream Oil (9m/15: RON 199 mn) and RON 8 mn in Downstream Gas (9m/15: RON 4 mn). Corporate & Other CAPEX was RON 3 mn (9m/15: RON 4 mn).
Compared to December 31, 2015, total assets increased by RON 289 mn, to RON 41,407 mn, mainly driven by a stronger cash and cash equivalents position, which more than compensated the decrease in non-current assets. The increase in intangible assets by RON 98 mn, which is mostly related to the operations at the Neptun Deep block in the Black Sea, was more than offset by the net decrease of RON 828 mn in property, plant and equipment, as depreciation and impairments exceeded investments during the period. Also, assets related to 19 marginal onshore fields were reclassified as assets held for sale following the signing of a transfer agreement with Mazarine Energy Romania S.R.L..
Equity marginally increased to RON 26,558 mn as of September 30, 2016 compared to RON 25,688 mn as of December 31, 2015, as a result of the net profit generated in the current period. The Group’s equity ratio increased to 64% as of end-September 2016, slightly higher than the level as of end-December 2015 (62%).
Total interest bearing debt decreased from RON 1,802 mn as of December 31, 2015 to RON 1,663 mn as of September 30, 2016, following partial loan reimbursements and the positive effect from the appreciation of RON vs. USD and EUR in the first nine months of 2016.
The Group’s liabilities other than interest bearing debt decreased by RON 441 mn, predominantly as a consequence of lower trade payables and other financial liabilities, broadly reflecting the reduction in capital expenditure and the completion of the exploration drilling campaign in the Black Sea.
OMV Petrom Group’s net debt decreased significantly to RON 124 mn compared to the December 31, 2015 level of RON 1,286 mn, due to the improved net cash position at the end of the period. Consequently, the gearing ratio decreased to 0.47% (December 31, 2015: 5.01%).
In 9m/16, the inflow of funds from profit before tax, adjusted for non-cash items such as depreciation and impairments, net change of provisions and other non-cash adjustments, as well as net interest and income tax paid was RON 3,221 mn (9m/15: RON 4,002 mn), while net working capital generated a cash inflow of RON 163 mn (9m/15: RON 177 mn). Cash flow from operating activities decreased by RON 795 mn compared to 9m/15, reaching RON 3,384 mn.
In 9m/16, the cash flow from investing activities resulted in an outflow of RON 2,258 mn (9m/15: RON 3,883 mn) mainly related to payments for investments in intangible assets and property, plant and equipment.
Free cash flow (defined as cash flow from operating activities less cash flow from investing activities) showed an inflow of funds of RON 1,127 mn (9m/15: RON 296 mn). Free cash flow less dividend payments resulted in a cash inflow of RON 1,126 mn (9m/15: outflow of RON 333 mn).
Cash flow from financing activities reflected a net outflow of funds amounting to RON 137 mn (9m/15: RON 746 mn), mainly arising from the repayment of tranches from the loans from the European Investment Bank and the European Bank for Reconstruction and Development, with 9m/15 also including payments of dividends for the year 2014.
Risk management
The scope of OMV Petrom’s business activity, both existing and planned, and the markets in which the company operates inherently expose it to significant commodity price, foreign exchange, operational and other risks. A detailed description of risks and risk management activities can be found in the 2015 Annual Report (pages 47-50).
For 2016, the main uncertainties which can influence the company’s performance remain the commodity price risk, operational risks as well as political and regulatory risk. The commodity price risk is being monitored constantly for developments and, when appropriate, protective measures are undertaken (e.g. entering into hedging agreements).
Through the nature of its business of extracting, processing, transporting and selling hydrocarbons, OMV Petrom is inherently exposed to safety and environmental risks. Through the company’s HSSE and risk management programs, OMV Petrom remains committed to be in line with industry standards.
In terms of political and regulatory risk, the company is in dialogue with the Romanian authorities on topics of relevance for the industry.
Also refer to the Outlook section of the Director’s report for more information on current risks.
Outlook 2016
Market, regulatory and fiscal environment
For the year 2016, we expect the average Brent oil price to be at USD 44/bbl. The Brent-Urals spread is anticipated to be wider than in recent years.
We estimate gas demand in Romania for 2016 to be below the 2015 level, with increased competition, including from import gas. Additional pressure on prices and margins is coming from recent amendments to the Energy Law, including the obligation for gas producers and suppliers to sell/buy via centralized platforms until 2021. In the power market, we anticipate demand for 2016 to be relatively stable vs. 2015, with improved spark spreads.
Refining margins in Q4/16 are projected to be above the Q3/16 level, along with an increase of fuels spreads. Low oil product prices, together with increased private consumption in Romania, are estimated to continue to support demand for oil products, despite seasonal decline and increased competition.
OMV Petrom Group
- CAPEX (including capitalized exploration and appraisal) for 2016 expected to be around EUR 0.6 bn, about 30% down yoy, with approx. 85% dedicated to Upstream;
- Exploration expenditures estimated to decrease by approx. 70% vs. the peak 2015 level, mainly due to the completion of drilling activities in the Neptun Block;
- Continued focus on cost discipline and portfolio optimization aiming for strong free cash flow generation.
Upstream
- Group’s full year average production decline is estimated to be up to 4% compared with 2015, due to natural decline not fully offset by the level of investments and the planned surface facilities upgrade at Totea Deep in October 2016;
- Production and development: estimated 1,000 workovers and 40 new wells for 2016;
- Exploration: two wells, one shallow offshore and one onshore, are planned to start drilling in Q4/16;
- Neptun Deep block (50% OMV Petrom; 50% ExxonMobil): more detailed work is ongoing to determine if commercial development is viable.
Downstream
- The refinery utilization rate is expected to be around 90% in 2016; we continue to focus on improving operational performance and delivering on economic energy efficiency upgrades;
- Despite challenges ahead, we focus on maintaining our position in the gas market through improved portfolio optimization and stronger customer orientation;
- Due to transformer failure, one gas turbine of the Brazi power plant will be unavailable for the rest of the year, which will affect the result (impact analysis still ongoing);
- Dorobantu wind park divestment: process ongoing.
Source: www.bvb.ro
See the full report here.

Recent Comments