
OMV Petrom Group: results for January – March 2017
Highlights Q1/17
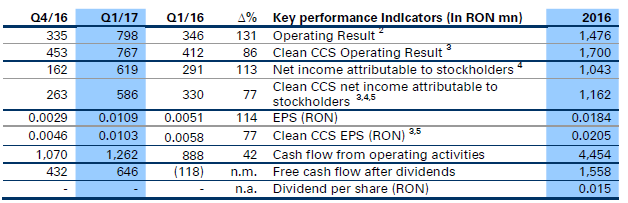
- Strong free cash flow of RON 646 mn
- Clean CCS Operating Result at RON 767 mn; more than half from Upstream
- OPEX reduced to USD 5/boe
Mariana Gheorghe, CEO of OMV Petrom S.A.:
“In Q1/17, we were able to convert improved market fundamentals into a solid operational and financial performance. We recorded a substantially improved operating cash flow of RON 1.3 bn, which together with CAPEX reduction led to a free cash flow of RON 646 mn. Increased oil prices and higher retail demand for fuels, coupled with our continued cost discipline, were reflected in a Clean CCS Operating Result of RON 767 mn, almost half of the entire 2016 figure. In Upstream, we further reduced production costs, while production decline was in line with our 2017 guidance, helped by the contribution from the Lebada Est NAG project. The Downstream Clean CCS Operating Result increased by 3% yoy, due to improved overall performance, strict cost management, and supported by strong refining margins. Our Q1/17 Operating Result was also supported by fiscal easing in Romania, in particular the elimination of the tax on special constructions starting January 2017. Overall, our strong Q1/17 performance shows delivery in terms of operational excellence in all business segments, in line with our strategic objectives to enhance competitiveness in the existing portfolio.”
Group performance
First quarter 2017 (Q1/17) vs. first quarter 2016 (Q1/16)
Compared to Q1/16, sales increased by 27%, supported by significantly higher oil prices and increased gas and power sales volumes, which more than offset the slightly lower volumes of petroleum products sold and the decrease in gas prices. Downstream Oil represented 69% of total consolidated sales, while Downstream Gas accounted for 28% and Upstream for 2% (sales in Upstream being largely intra-group sales rather than third-party sales).
The Clean CCS Operating Result of RON 767 mn improved compared to RON 412 mn in Q1/16, as a consequence of a more favorable market environment and better demand. Clean CCS Operating Result for Q1/17 is stated after eliminating special income of RON 5 mn, and inventory holding gains of RON 26 mn. In turn, the Q1/16 figure was stated after eliminating net special income of RON 111 mn and inventory holding losses of RON (177) mn. Starting with Q1/17, special items include temporary effects from commodity hedging (in order to mitigate Income Statement volatility).
The Group Operating Result for Q1/17 increased to RON 798 mn, compared to RON 346 mn in Q1/16, driven mainly by higher sales revenues and the elimination of the tax on special constructions starting 2017, while Q1/16 benefitted from a special income in relation to the final court decision to reduce the fines imposed by the Competition Council in 2011.
The net financial result deteriorated from a loss of RON (3) mn in Q1/16 to a loss of RON (56) mn in Q1/17, as Q1/16 was influenced by the positive outcome of the company’s appeal to the fiscal review decision in the Kazakh branch.
As a result, profit before tax for Q1/17 of RON 742 mn was significantly higher compared with RON 343 mn recorded in Q1/16.
The Income tax was at the amount of RON (124) mn, while the effective tax rate was 17% in Q1/17 (Q1/16: 16%).
Net income attributable to stockholders of the parent was RON 619 mn, while clean CCS net income attributable to stockholders was RON 586 mn. EPS was RON 0.0109 in Q1/17 vs. RON 0.0051 in Q1/16, while Clean CCS EPS was RON 0.0103 compared to RON 0.0058 in Q1/16.
Cash flow from operating activities increased to RON 1,262 mn from RON 888 mn in Q1/16, mainly as a result of higher profit before tax. Free cash flow after dividends showed an inflow of funds of RON 646 mn (Q1/16: outflow of RON 118 mn).
First quarter 2017 (Q1/17) vs. fourth quarter 2016 (Q4/16)
Consolidated sales in Q1/17 amounted to RON 4,653 mn, 1% lower compared to Q4/16, mainly due to seasonally lower sales volumes of petroleum products, as well as lower volumes of electricity sold, which more than offset the positive effect of higher quotations and of increased quantities of natural gas sold, caused by colder weather conditions.
The Clean CCS Operating Result increased from RON 453 mn to RON 767 mn, mainly reflecting lower exploration expenses and operating costs, as well as the elimination of the tax on special constructions starting 2017. The Clean CCS Operating Result is stated after eliminating special income of RON 5 mn and inventory holding gains of RON 26 mn (Q4/16: special charges of RON (193) mn and inventory holding gains of RON 75 mn).
The Group Operating Result increased to RON 798 mn (Q4/16: RON 335 mn), as the Q4/16 result was also influenced by special charges, mainly in relation to the reassessment of receivables and provisions.
The net financial result improved from a loss of RON (102) mn in Q4/16 to a loss of RON (56) mn in Q1/17, influenced by the lower FX negative effect in relation to bank loans denominated in EUR.
As a result, profit before tax for Q1/17 of RON 742 mn was well above the RON 233 mn recorded in Q4/16.
Net income attributable to stockholders of the parent in Q1/17 was RON 619 mn, compared to RON 162 mn in Q4/16, while clean CCS net income attributable to stockholders increased to RON 586 mn from RON 263 mn in Q4/16. EPS was RON 0.0109 in Q1/17 vs. RON 0.0029 in Q4/16, while Clean CCS EPS was RON 0.0103 compared to RON 0.0046 in Q4/16.
Cash flow from operating activities amounted to RON 1,262 mn, higher than the Q4/16 level of RON 1,070 mn. Free cash flow after dividends amounted to RON 646 mn (Q4/16: RON 432 mn).
Statement of financial position and capital expenditure
Capital expenditure decreased to RON 353 mn (Q1/16: RON 769 mn), mainly due to reduced expenditures from Neptun Deep and the finalization of some FRD projects in 2016.
Upstream investments in Q1/17 were RON 324 mn, compared to RON 710 mn in Q1/16. Downstream investments amounted to RON 29 mn (Q1/16: RON 59 mn), thereof RON 28 mn in Downstream Oil (Q1/16: RON 58 mn). Corporate and Other CAPEX was RON 1 mn (Q1/16: RON 1 mn).
Compared to December 31, 2016, total assets increased by RON 186 mn, to RON 41,600 mn, mainly driven by a higher cash and cash equivalents position, which more than offset the decrease in non- current assets. The slight increase in intangible assets by RON 21 mn, which is mostly related to the operations at the Neptun Deep block in the Black Sea, was more than offset by the net decrease of RON 462 mn in property, plant and equipment, as depreciation and impairments exceeded investments during the period.
Equity increased to RON 27,329 mn as of March 31, 2017 compared to RON 26,706 mn as of December 31, 2016, as a result of the net profit generated in the current period. The Group’s equity ratio of 66% as of end-March 2017 was slightly higher than at end-December 2016 (64%).
Total interest bearing debt slightly increased from RON 1,550 mn as of December 31, 2016 to RON 1,570 mn as of March 31, 2017.
The Group’s liabilities other than interest bearing debt decreased by RON 457 mn, predominantly as a result of lower trade payables, broadly reflecting the reduction in capital expenditure.
Due to the significant cash balance at March 31, 2017, OMV Petrom Group maintained a net cash position of RON 872 mn (December 31, 2016: RON 237 mn).
Cash flow
In Q1/17, the inflow of funds from profit before tax, adjusted for non-cash items such as depreciation and impairments, net change of provisions and other non-cash adjustments, as well as net interest and income tax paid, was RON 1,438 mn (Q1/16: RON 942 mn), while net working capital generated a cash outflow of RON 176 mn (Q1/16: RON 54 mn). The Cash flow from operating activities increased by RON 374 mn compared to Q1/16, reaching RON 1,262 mn.
In Q1/17, the cash flow from investing activities resulted in an outflow of RON 616 mn (Q1/16: RON 1,007 mn) mainly related to payments for investments in intangible assets and property, plant and equipment.
Free cash flow (defined as cash flow from operating activities less cash flow from investing activities) showed an inflow of funds of RON 646 mn (Q1/16: outflow of RON 118 mn). Free cash flow less dividend payments resulted in a cash inflow of RON 646 mn (Q1/16: outflow of RON 118 mn).
The Cash flow from financing activities implied a net inflow of funds amounting to RON 9 mn (Q1/16: outflow of RON 41 mn), reflecting higher cash pooling balances payable to the associate (OMV Petrom Global Solutions), which more than offset the repayment of the tranche from the loan from the European Investment Bank.
Risk management
The scope of OMV Petrom’s business activity, both existing and planned, and the markets in which the company operates inherently expose it to significant commodity price, foreign exchange, operational and other risks. A detailed description of risks and risk management activities can be found in the 2016 Annual Report (pages 55-57).
In 2017, the main uncertainties which can influence the company’s performance remain the commodity price risk, operational risks as well as political and regulatory risk. The commodity price risk is being monitored constantly for developments and, when appropriate, protective measures are undertaken (e.g. entering into hedging agreements).
Through the nature of its business of extracting, processing, transporting and selling hydrocarbons, OMV Petrom is inherently exposed to safety and environmental risks. Through the company’s HSSE and risk management programs, OMV Petrom remains committed to be in line with industry standards.
In terms of political and regulatory risk, the company is in dialogue with the Romanian authorities on topics of relevance for the industry.
Also refer to the Outlook section of the Director’s report for more information on current risks.
Outlook for the full year 2017
- Market, regulatory and fiscal environment
- Average Brent oil price expected to be USD 55/bbl; Brent-Urals spread anticipated to slightly decrease yoy;
- Gas demand in Romania estimated to remain broadly flat yoy, with high competition and margin pressure;
- Starting April 1, 2017, gas producers are released from the obligation to supply households with priority. ANRE will no longer set the price at which domestic production will be sold by producers; however, the regulator will continue to set the end prices for households until June 30, 2021;
- Power demand anticipated to be relatively stable yoy, with positive average spark spreads;
- Refining margins projected to be on a similar level yoy; following a strong performance in Q1/17, refining margins are expected to trend downwards for the rest of the year; lower product prices resulting from fiscal easing in Romania will continue to support market demand;
- Taxation:
- Starting April 1, 2017, the RON 72/MWh floor considered for computing the 60/40 tax on revenues from gas price liberalization was replaced with the realized gas price;
- Further developments are expected with respect to upstream oil and gas taxation, with public consultations still to take place;
- A stable, predictable and investment-friendly fiscal and regulatory framework is a key requirement for our future investments, both onshore and offshore
OMV Petrom Group
- OMV Petrom expects to generate a positive free cash flow after dividends, through continuous cost discipline;
- CAPEX (including capitalized exploration and appraisal) currently anticipated to be around EUR 8 bn, about 40% higher yoy, with approximately 85% dedicated to Upstream;
- We aim for a sustainable cost base with potential upside from ongoing efficiency programs.
Upstream
- Daily average production decline up to 3% yoy, not including portfolio optimization initiatives;
- Portfolio optimization: closing the 19 marginal fields transfer by mid year; initiating further field divestments;
- Production and development: estimated 1,000 workovers and around 70 new wells for 2017;
- Exploration: ten wells planned to be spudded until year
Downstream
- Maintaining a refinery utilization rate above 90%;
- We strive to maintain gas sales volumes at around 50 TWh, against the backdrop of overall lower offtake by the Brazi power plant;
- Due to the steam turbine transformer failure on April 21, 2017, coupled with the previously announced failure of one gas turbine transformer, the Brazi power plant is currently unavailable. From today’s perspective, we will be able to resume operations in Q3/17;
- Dorobantu wind park divestment: aimed to be finalized until year-end.

Recent Comments